By a margin of 57% to 43%, California voters in 2020 rejected Proposition 16, which would have allowed the state and local governments to use race and gender as factors in public college admissions, government jobs, and state and local contracting. This essay, based on two research papers for the Center for Equal Opportunity, shows how widespread the rejection was.
Background
Back in 1996, voters passed Prop 209, which prohibited the use of race, ethnicity, and gender in government jobs, government contracts, and public higher education. Back then, whites were the majority, and Prop 209 won with 55% of the vote. The prohibition was then written into the California Constitution.
On the ballot in 2020, Proposition 16 would give the state new powers to once again use racial, ethnic, and gender preferences. Prop 16 supporters firmly believed that California voters would pass the ballot initiative. After all, there was large popular support for the Black Lives Matter movement, California was now a majority-minority state, and polling showed overwhelming support for Biden over Trump.
Moreover, Prop 16 had the backing of California’s elite—its two U.S. Senators, many of its U.S. Representatives, California’s governor, its attorney general, many state and local politicians, professional sports teams, labor unions, the ACLU, business elites, and major media outlets. Many of the business elite donated millions to the campaign, and activists significantly outspent the opposition by roughly 14 to 1.
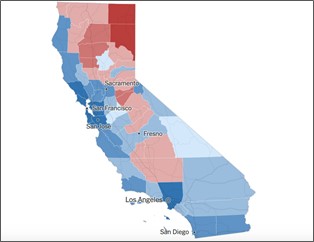
California voters overwhelmingly voted for Joe Biden, 64% to 34%. But 57% voted “No” on Prop 16.
The polls of likely voters in October raised the possibility that Prop 16 would fail. But all significantly underestimated how many voters would vote “No” on Prop 16.
- The poll closest to election day found 38% for Prop 16 and 49% against.
- Two found a 50-50 tie.
- Ipsos in early October showed Prop 16 leading, 38% to 28%.
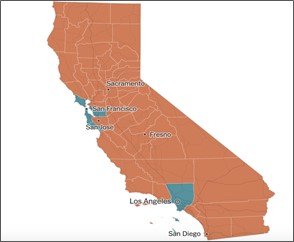
The polls were wrong by at least seven percentage points in predicting the “No” vote. How widespread was the rejection? The maps of California counties below (Figure 1) show the contrast between Biden/Trump votes on the right and Yes/No votes on the left.
County-by-County Results
Figure 1 California Counties’ Presidential Vote and Votes on Prop 16


Source: New York Times, “California Election Results: President, Results by County;” New York Times, “California Proposal 16 Election Results: Repeal Ban on Affirmative Action, Results by County.”
The map on the left shows the counties with a majority of Biden votes in blue and Trump votes in red. Darker shades of blue and red mean a larger percentage per county. The map on the right shows the “Yes” on 16 counties in aqua and the “No” on 16 in orange.
- In 52 counties, a majority voted “No.” Only six had majority-support for Prop 16.
- The pro-16 votes mostly centered around the Bay area, with the largest percentage in San Francisco (64%), followed by Alameda (59%), Marin County (56%), San Mateo (51%), and Santa Cruz (52%).
- In LA County, California’s most populous county, only 51% voted for Prop 16, despite a majority minority population of 73% non-white.
The total “Yes” vote made up less than two-thirds of the Biden vote. Distributed across the counties, this accounts for the overwhelming number of counties “turning orange.” There were zero California counties where the percentage of the “Yes” vote came close to or exceeded the Biden vote.
County Demographics and Support for Prop 16
I subsequently generated simple statistics at the county level, examining more closely the relationship (or lack thereof) between race/ethnicity and Prop 16.
- The most robust relationship was between a county’s percentage of college graduates and “Yes” on 16, not race (r=0.740; r2=0.5476).
- There was no statistically significant correlation between proportion of Hispanics and votes for or against Prop 16 (r=0.156; r2 = 0.0243).
- Counties with greater percentages of blacks had more support for Prop 16, but the statistical association was small (r=0.309; r2 = 0.0956).
- Counties with greater percentages of whites had fewer pro-Prop 16 votes (r= –0.417; r2 = 0.1742).
- There was a strong relationship between larger percentages of Asian residents and support for Prop 16 (r=-.595; r2 = 0.3544). The relationship disappeared, however (i.e., became statistically nonsignificant) after statistically controlling for a county’s percentage of college graduates. That is, the higher the percentage of college graduates in a county, the more votes for Prop 16.
After the Vote: Elites’ Explanations
In its aftermath, California elites argued that voters were confused—supporters did not reach enough minorities; supporters failed to explain Prop 16 properly; and the proposition was badly written. Furthermore, Asian Americans did not properly understand Prop 16, according to Natalie Masuoka, UCLA Professor of Political Science and Chair of the Asian American Studies department. “[F]or Asian Americans, it’s not clear how strongly they oppose affirmative action. Voter education could be really essential in this case.” Chon Noriega, director of UCLA’s Chicano Studies Research Center, believed the same for Hispanic voters; many misunderstood the meaning of Prop 16. Noriega also blamed the defeat on a poorly written proposition.
In short, minorities, including Asian Americans, suffered from false consciousness and did not properly understand their own interests.
But who was really deceptive and misleading? California’s elite had no problem with ads portraying the anti-Prop 16 groups as white supremacists. Actually, many anti-Prop 16 activists and donors were not white supremacists but Asian Americans. (Some opponents of Prop 16 saw the white supremacist ad as actually aiding in Prop 16’s defeat.)
It is the media, academia, and the political elite, not anti-Prop 16 activists, who obscured the meaning of Prop 16 by calling the measure “affirmative action.” Prop 16 enabled racial preferences, not minority outreach, and not minority mentoring (which are legal under California law). Elites later made the excuse that voters were confused. Final numbers suggest that a majority of voters simply disliked racial/ethnic/gender preferences.


